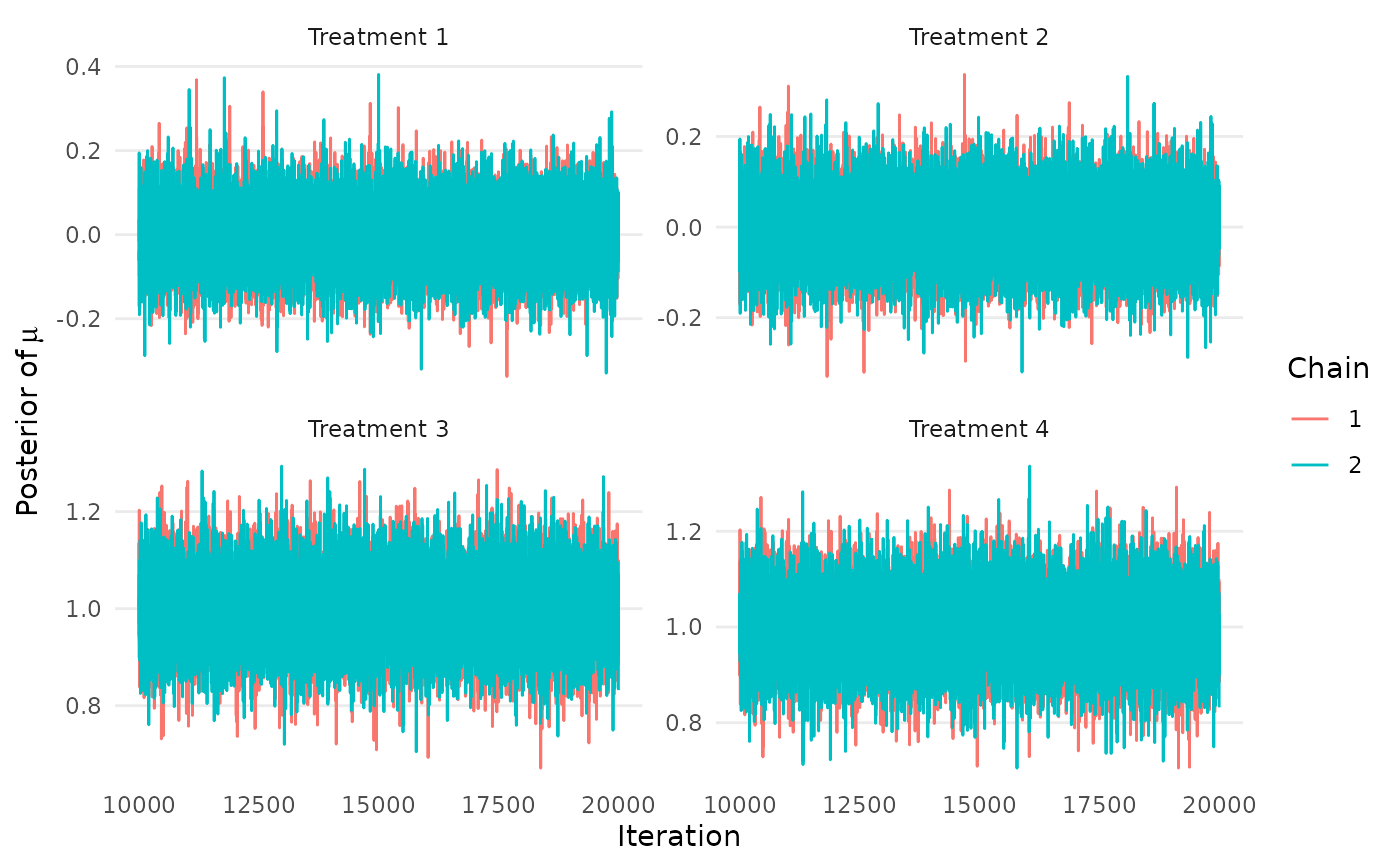
This function creates trace plots for the mu parameter in the form of a ggplot.
traceplot_mu(mcmc, names = NULL)Arguments
Value
A ggplot of trace plots for the mu parameter.
Examples
mcmc <- mcmc_raceNMA(mu_hat=c(0,0,1,1), s=c(.1,.1,.1,.1), seed=1)
#> Estimating chain 1 of 2.
#> Estimating chain 2 of 2.
traceplot_mu(mcmc,names=paste0("Treatment ",1:4))