Create posterior forest plots for relative treatment effect estimates from a standard or RaCE NMA study
Source:R/forestplot_muhat.R
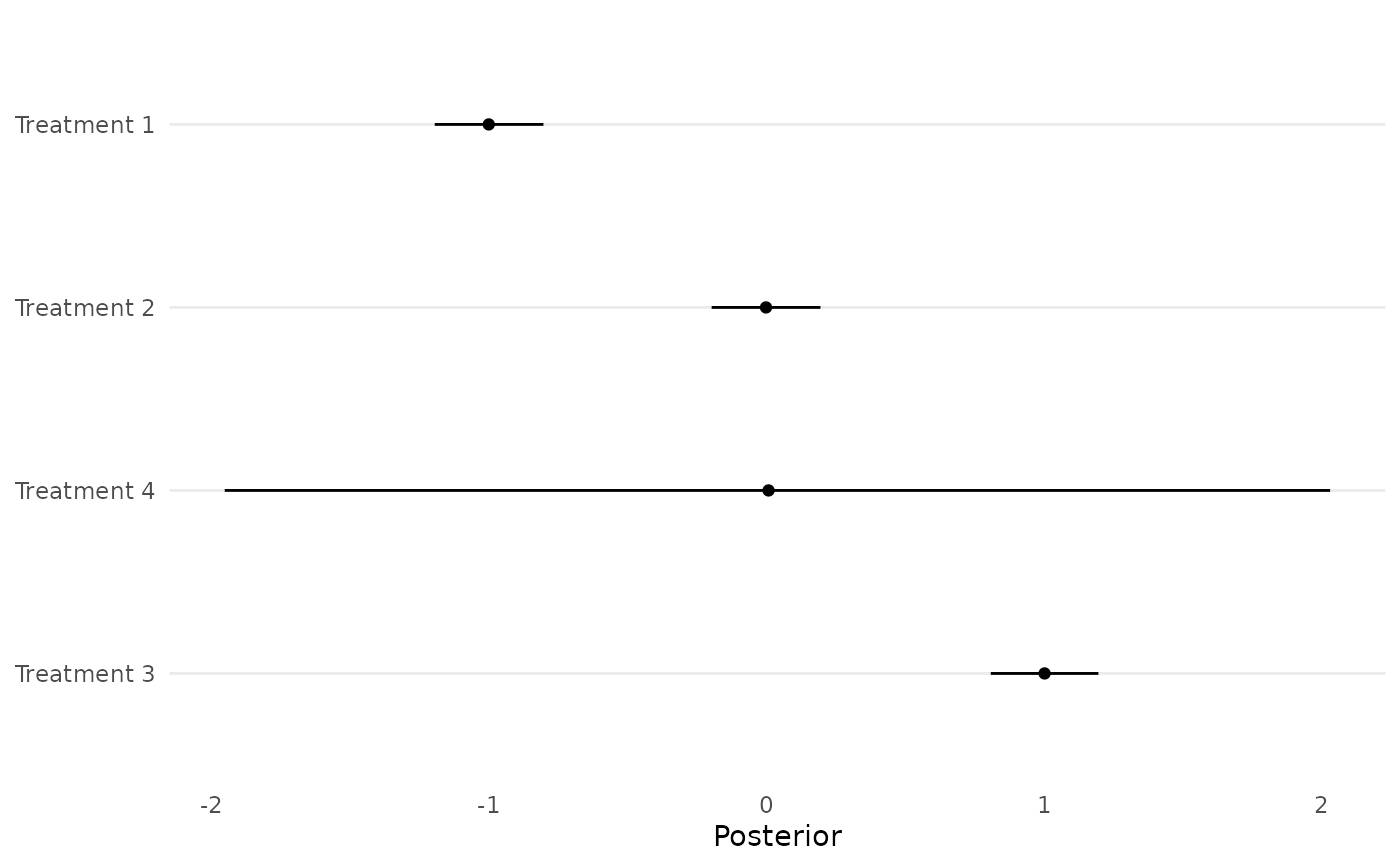
forestplot_muhat.RdThis function creates posterior forest plots for relative treatment effect estimates from a standard or RaCE NMA study.
forestplot_muhat(
  data = NULL,
  mcmc = NULL,
  names = NULL,
  level = 0.95,
  order_by_average = TRUE
)
Arguments
- data
A NxJ matrix of data to display as a forest plot, where N is the number of observations and J the number of treatments. This feature is designed for use to display a forest plot of results from a standard NMA study.
- mcmc
MCMC draws from the RaCE NMA model, in the form of the model output of the
mcmc_RCMVNfunction.- names
A vector of intervention names (optional)
- level
A numeric indicating the desired credible level to be displayed, as a proportion. Defaults to 0.95.
- order_by_average
A boolean indicating if plot should order treatments by their average treatment effect.
Value
A ggplot of posterior forest plots for the mu parameter.