Create a cumulative ranking plot in RaCE NMA models
Source:R/cumulativeprobplot_ranks.R
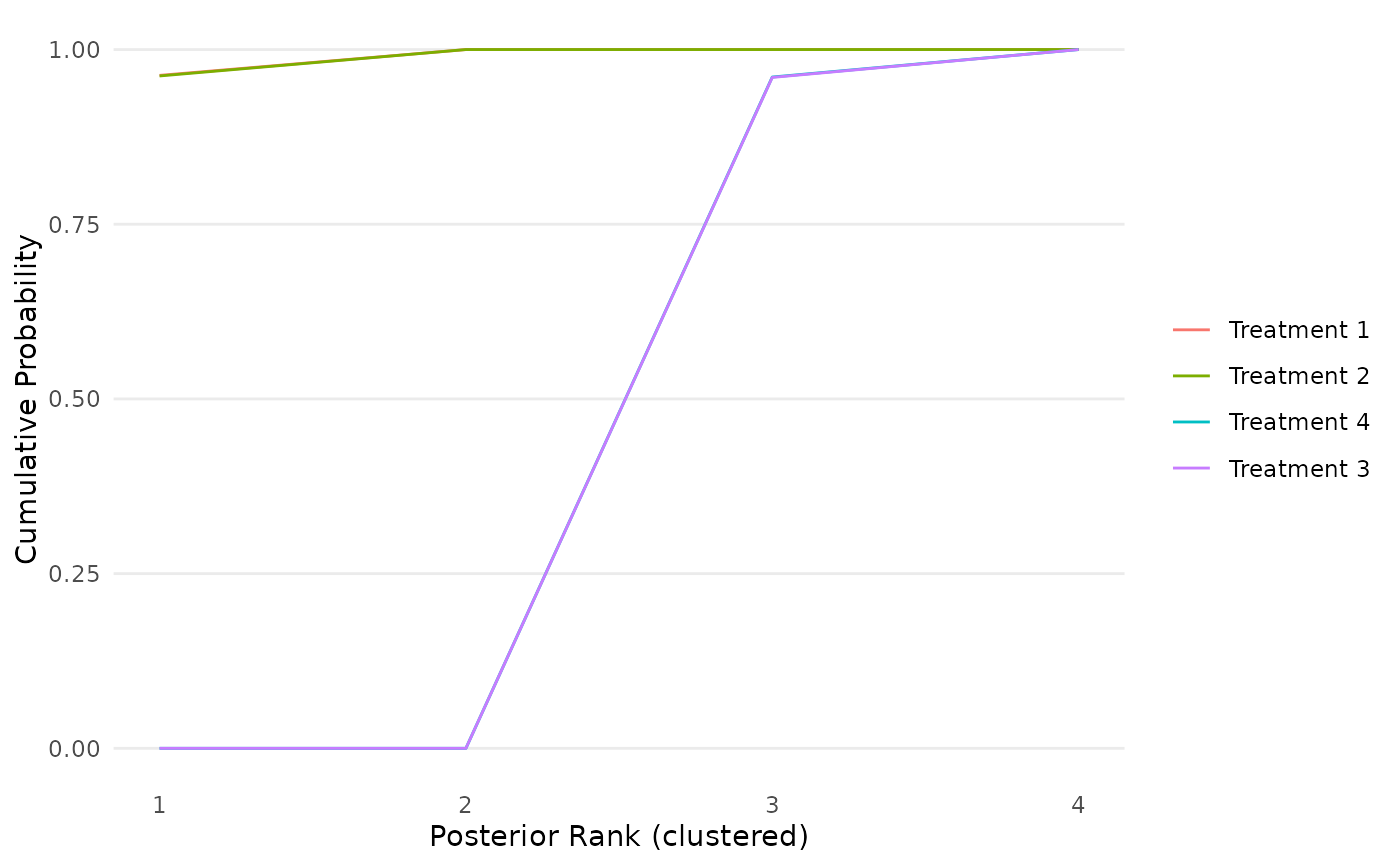
cumulativeprobplot_ranks.RdThis function creates a cumulative ranking plot in the form of a ggplot.
cumulativeprobplot_ranks(data = NULL, mcmc = NULL, names = NULL)Arguments
- data
A NxJ matrix of data, where N is the number of observations and J the number of treatments. This feature is designed to display results from a standard NMA study.
- mcmc
MCMC draws from the RaCE NMA model, in the form of the model output of the
mcmc_RCMVNfunction.- names
A vector of intervention names (optional)
Value
A ggplot of a cumulative ranking plot.
Examples
mcmc <- mcmc_raceNMA(mu_hat=c(0,0,1,1), s=c(.1,.1,.1,.1), seed=1)
#> [1] "Estimating chain 1 of 2."
#> [1] "Estimating chain 2 of 2."
cumulativeprobplot_ranks(mcmc=mcmc,names=paste0("Treatment ",1:4))