Create a posterior clustering matrix for the interventions based on RaCE NMA models
Source:R/clusterplot_ranks.R
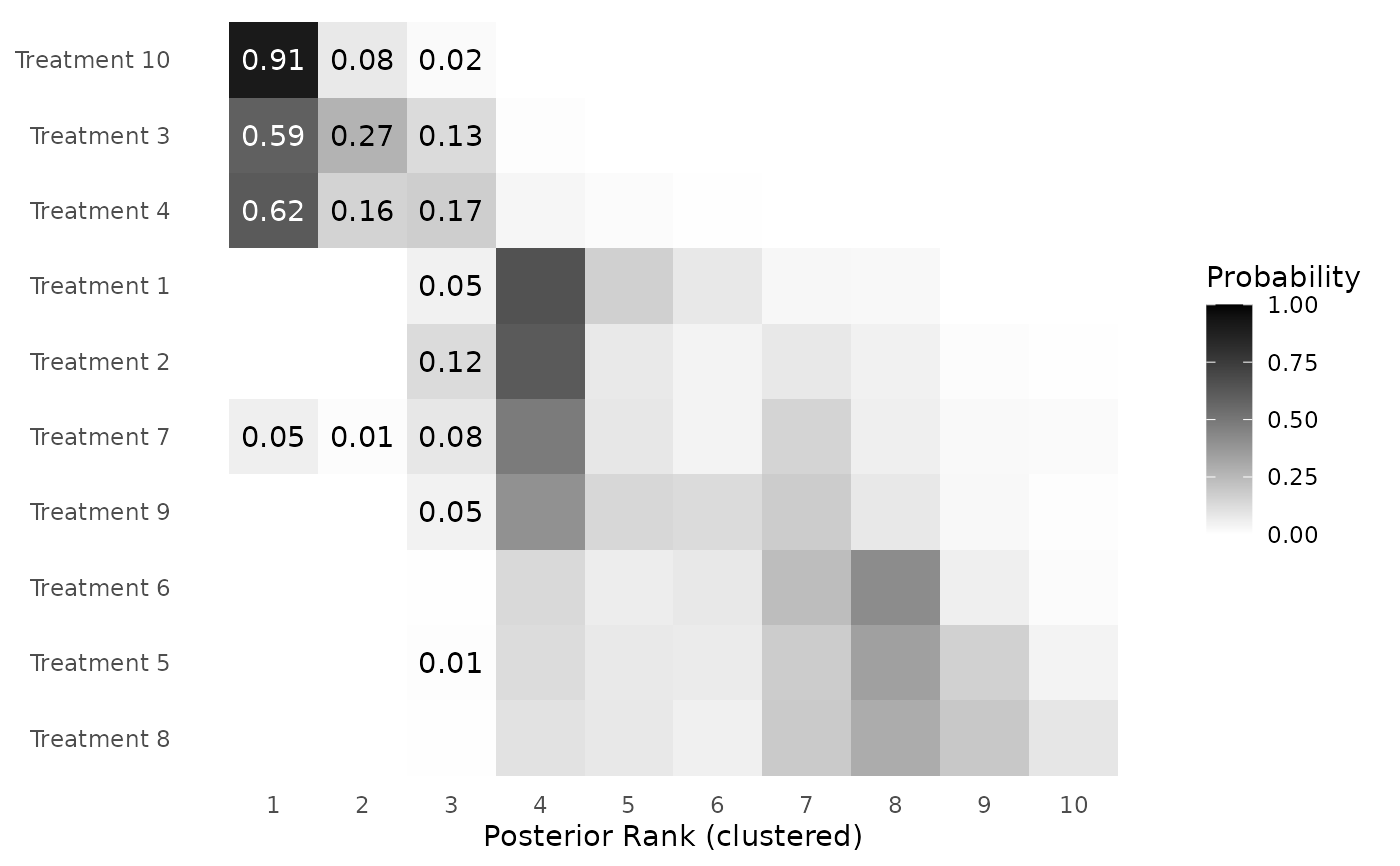
clusterplot_ranks.RdThis function creates a posterior clustering matrix for the interventions in the form of a ggplot.
clusterplot_ranks(data = NULL, mcmc = NULL, names = NULL, label_ranks = NULL)Arguments
- data
A NxJ matrix of data, where N is the number of observations and J the number of treatments. This feature is designed to display results from a standard NMA study.
- mcmc
MCMC draws from the RaCE NMA model, in the form of the model output of the
mcmc_RCMVNfunction.- names
A vector of intervention names (optional)
- label_ranks
A vector containing rank levels for which posterior rank probabilities should be displayed within the clustering matrix. Only non-zero probabilities are displayed. Defaults to
NULL, indicating no probabilities are displayed as text.
Value
A ggplot of a posterior clustering matrix for the interventions.
Examples
data("toy_data")
mcmc <- mcmc_raceNMA(posterior=toy_data,iter=500,nu_iter=2,chains=1)
#> [1] "Estimating chain 1 of 1."
clusterplot_ranks(mcmc=mcmc,names=paste0("Treatment ",1:10),label_ranks=1:3)